NPC19 Poster-Analyzing Bikeshare Activity Using R and Bing API
This poster was exhibited at APA NPC19 as a student poster. This is a group work by Chris Chang and Meng Gao.
 Download the full-size poster: click here.
Read the study:
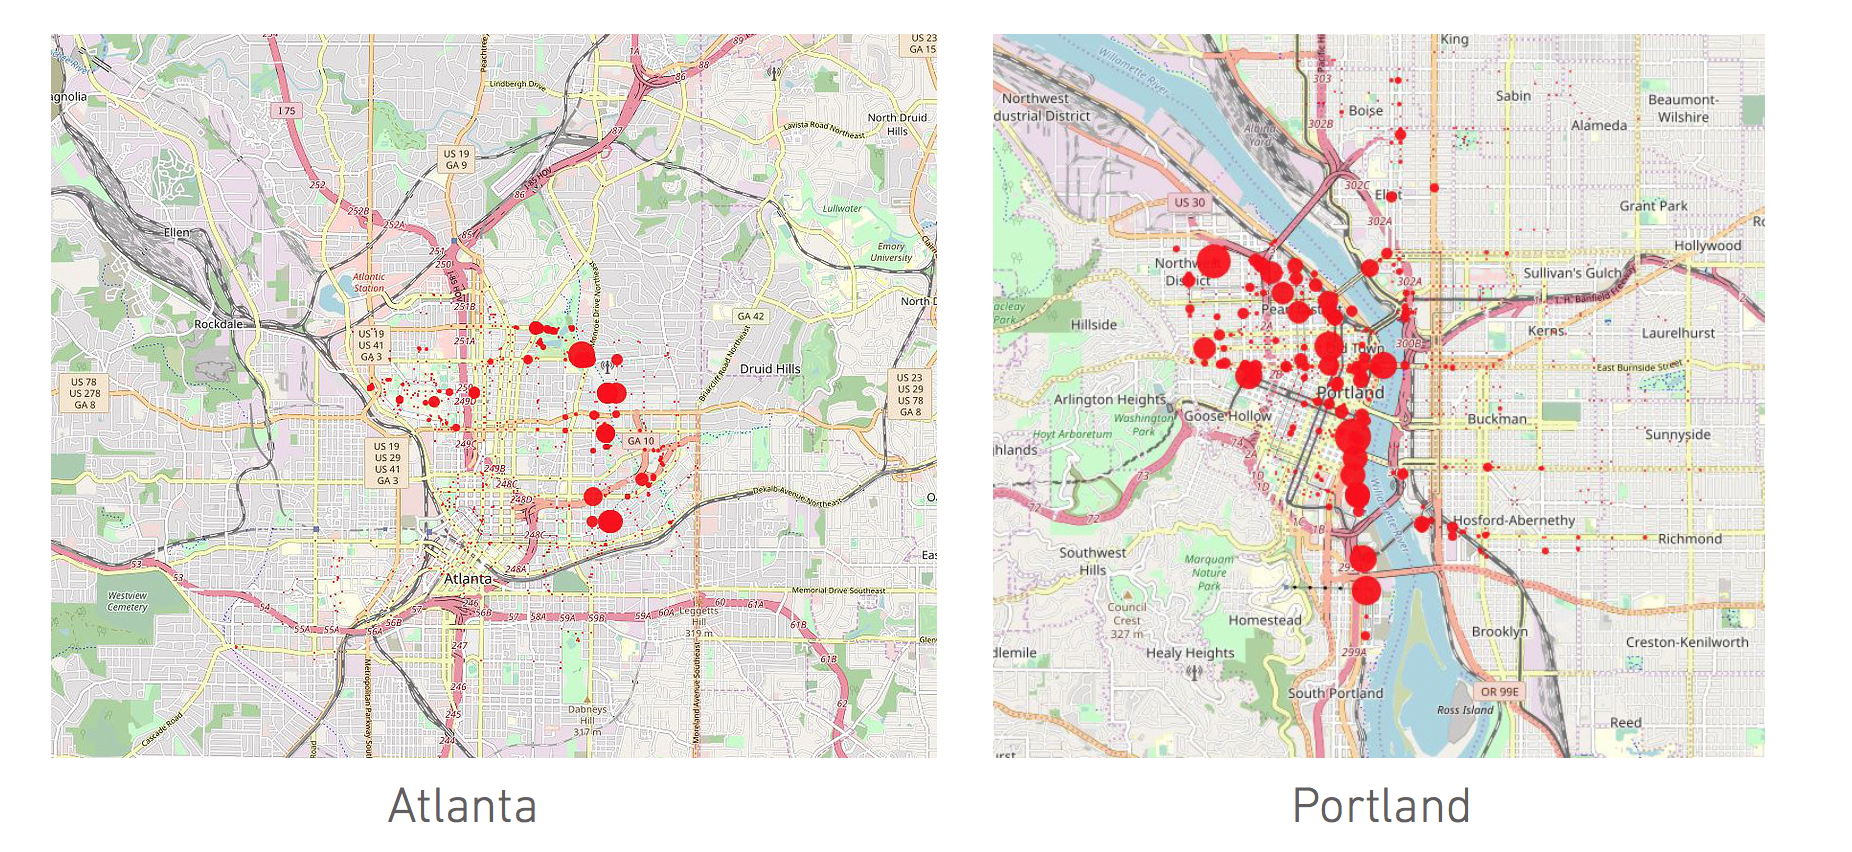
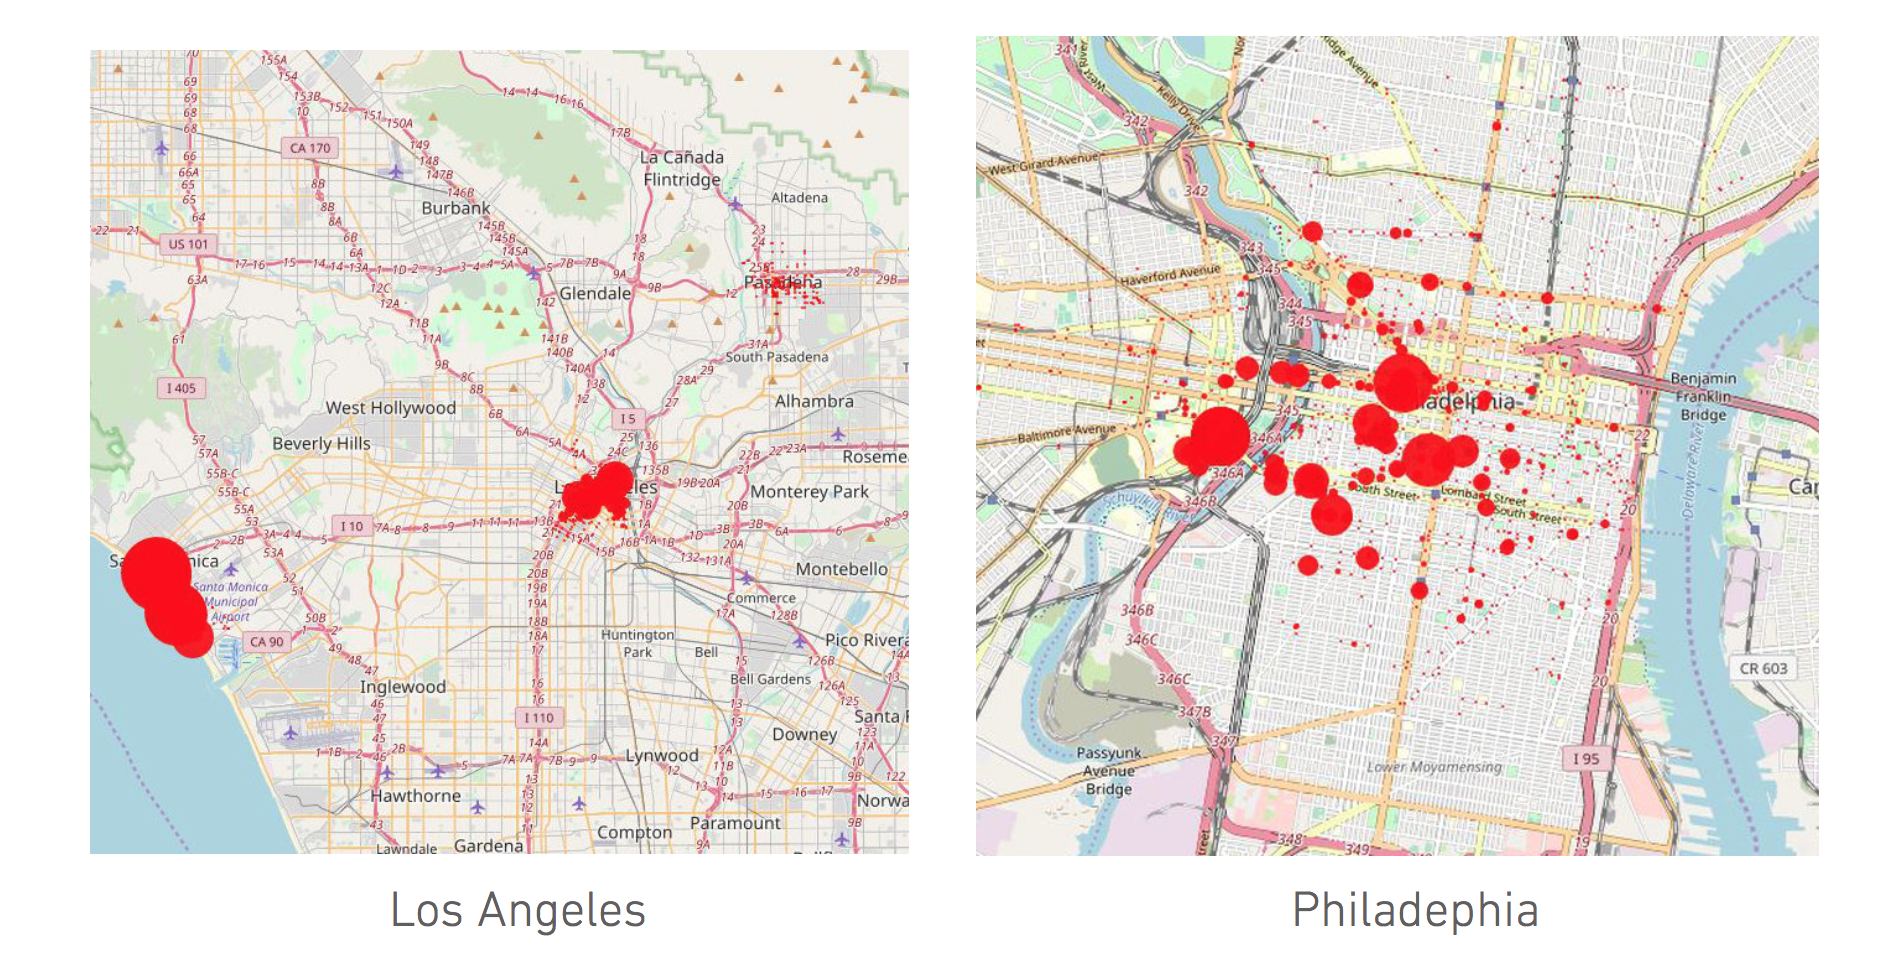
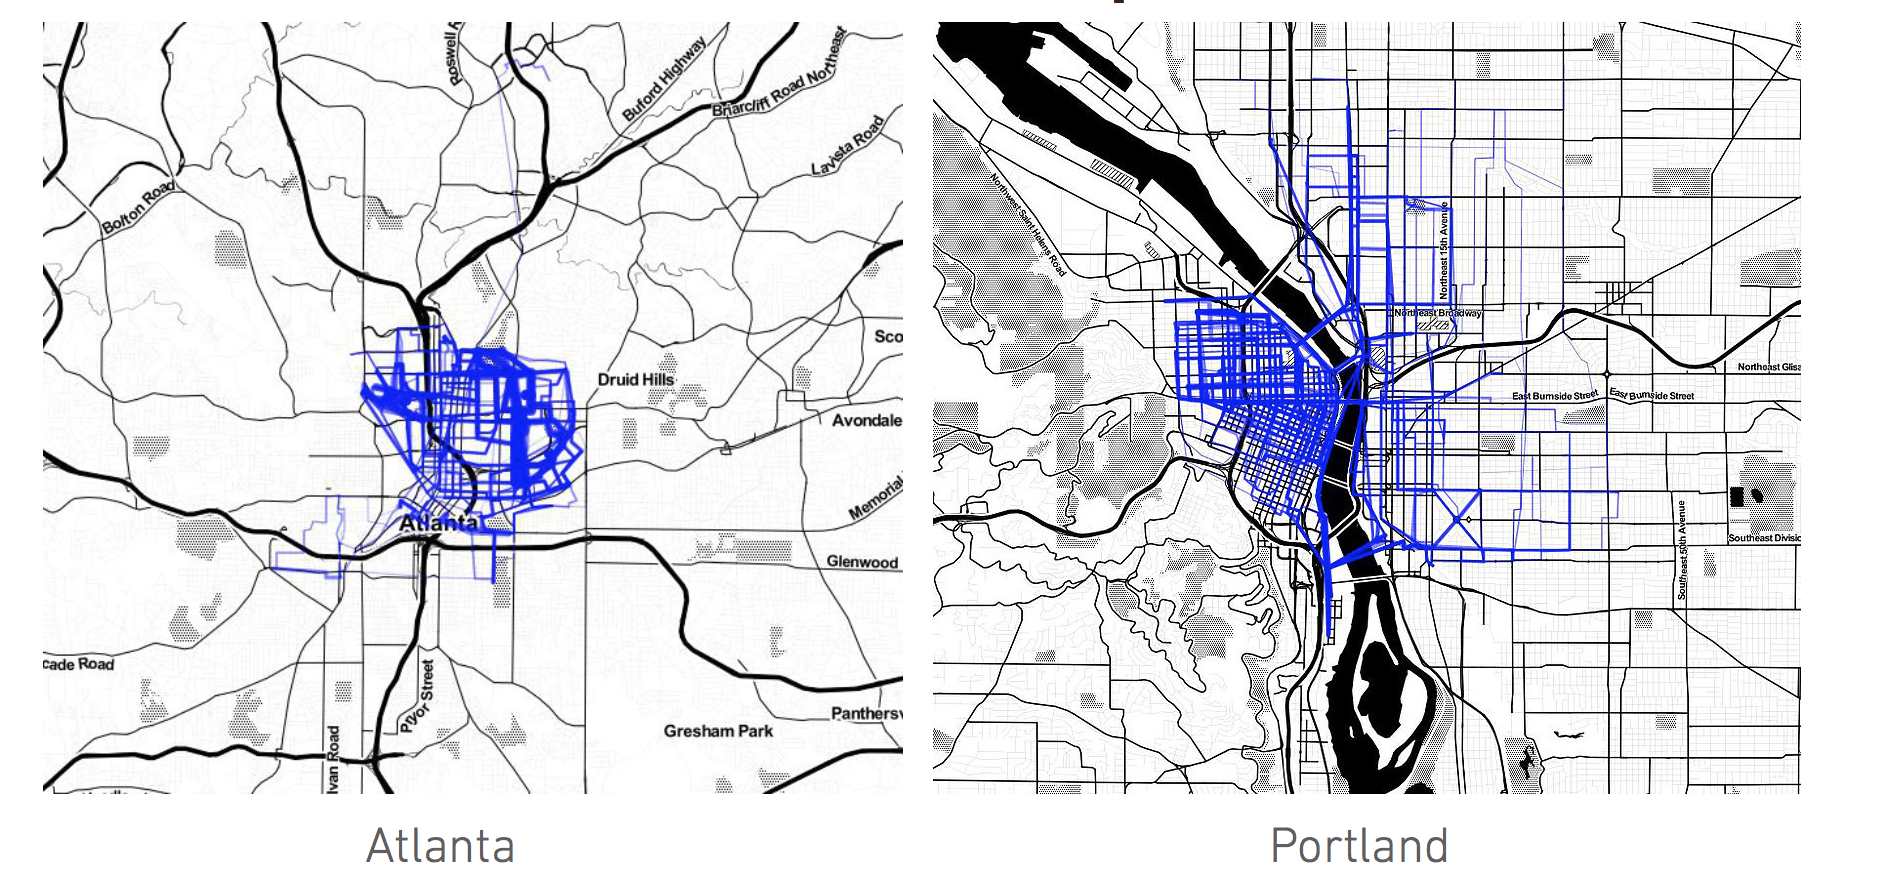
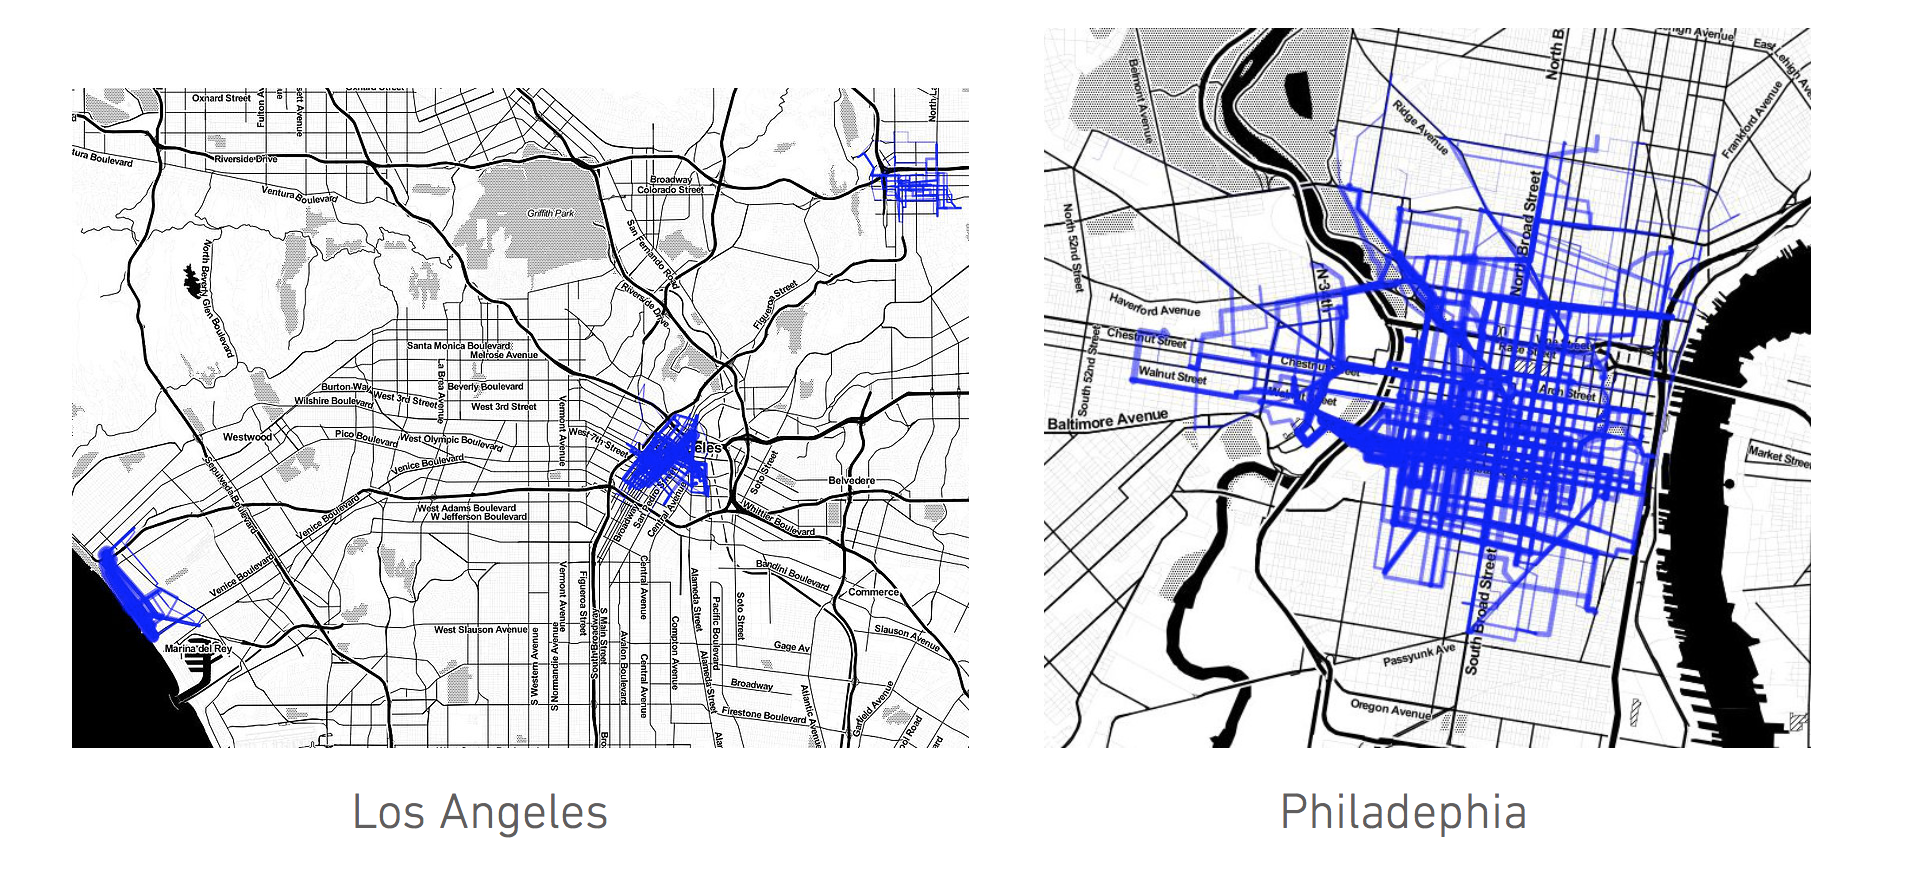
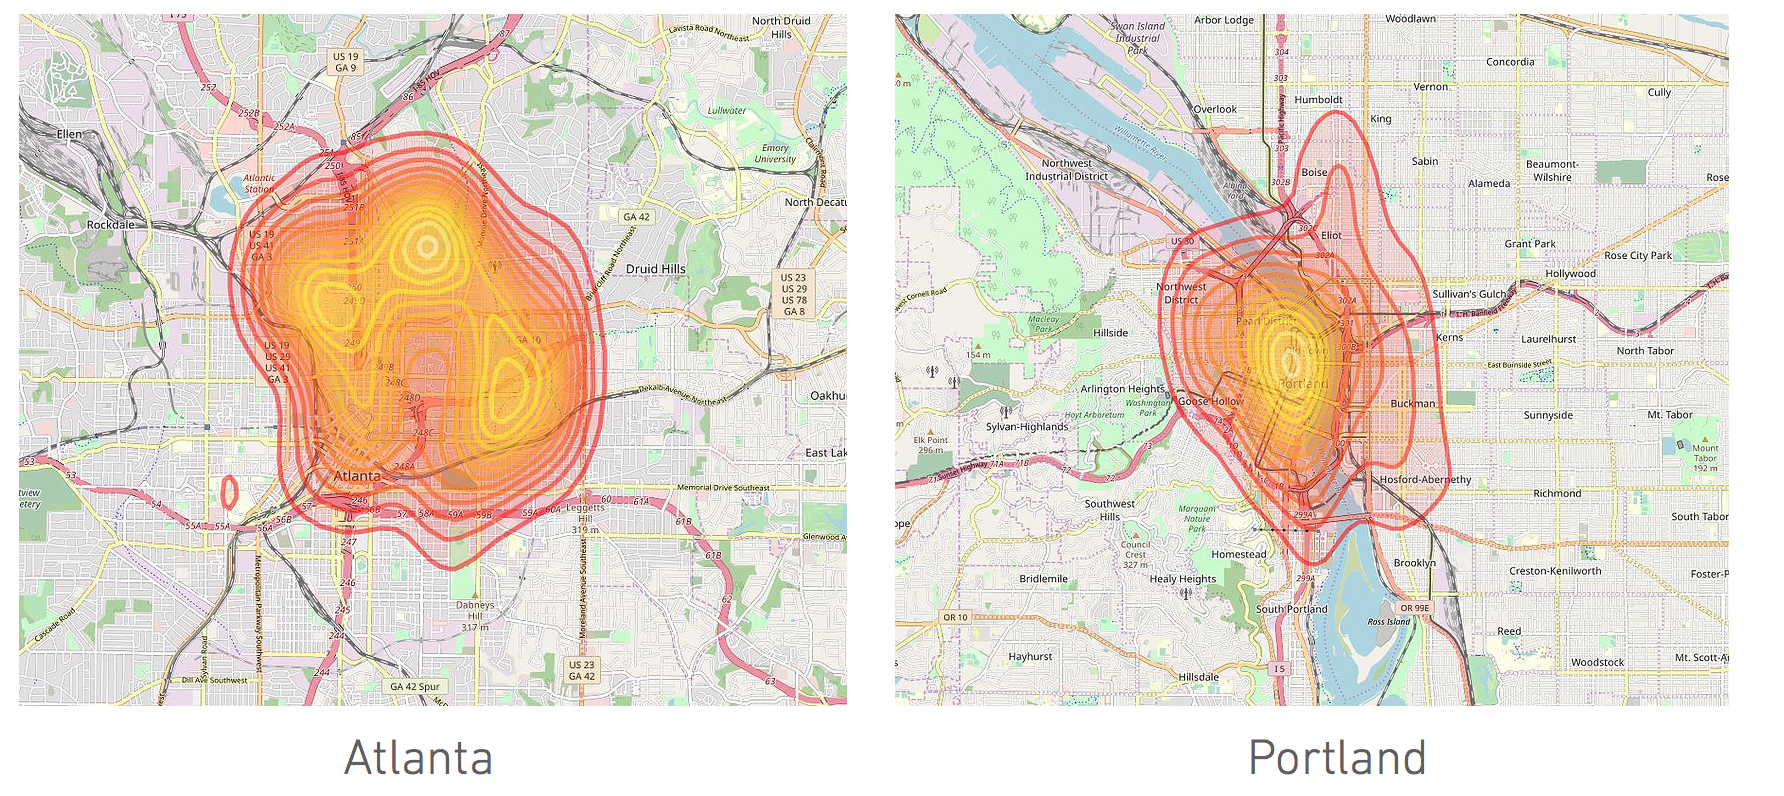
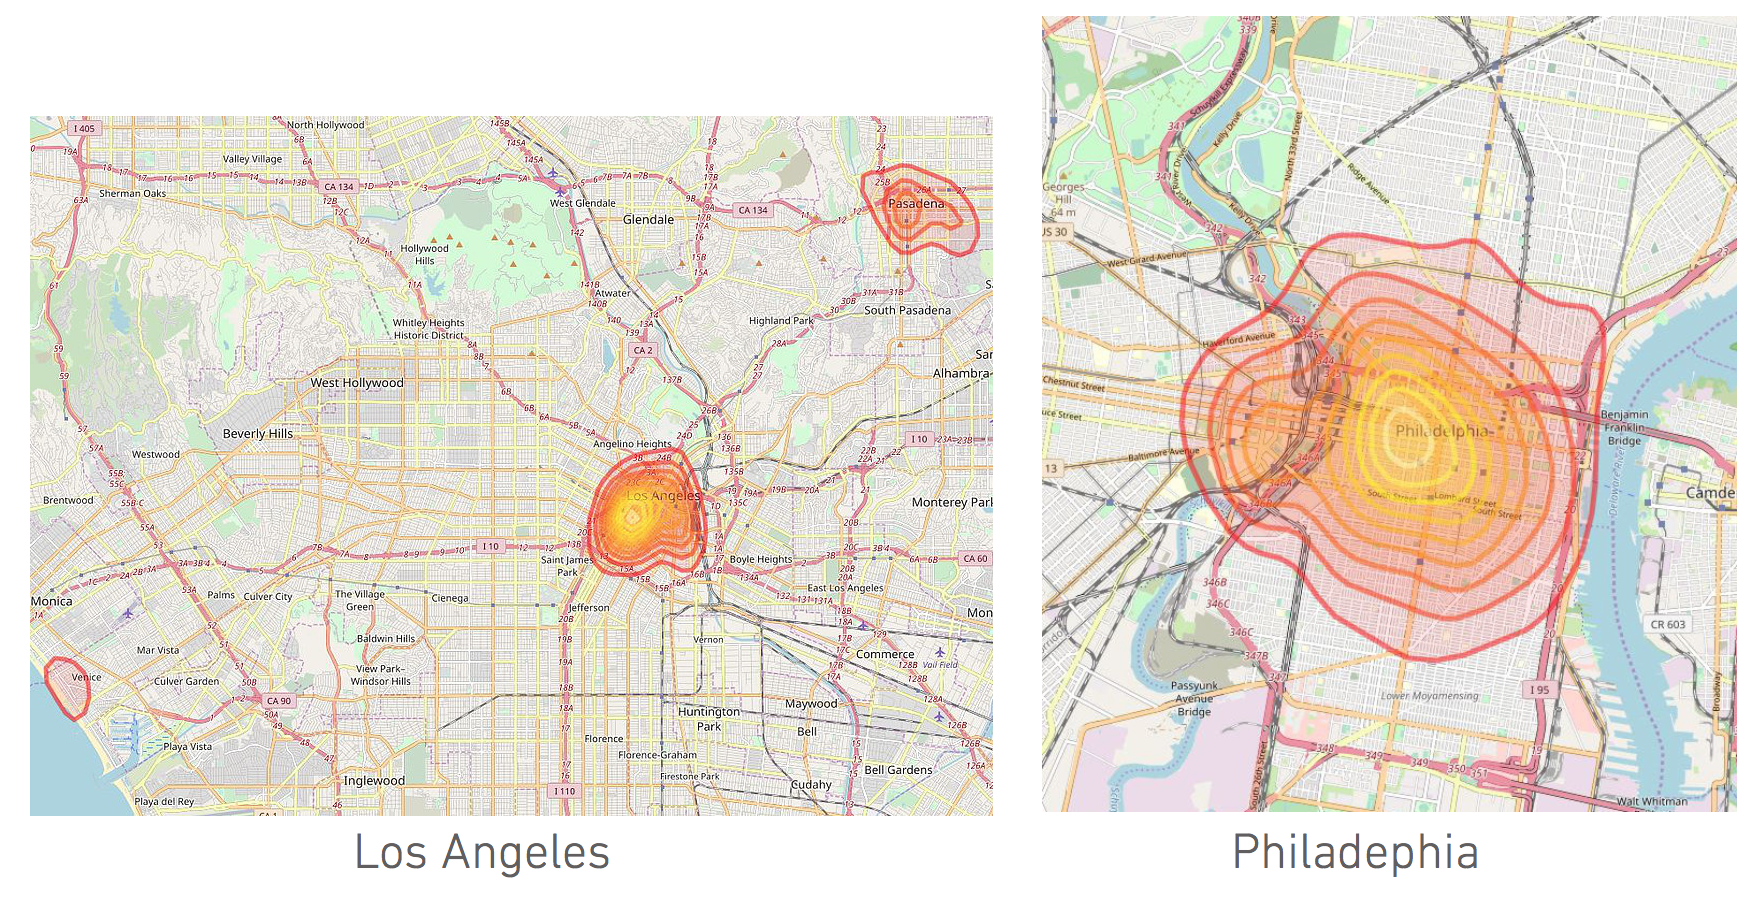
Bike Share hot spots and route visualization for Atlanta, Portland, Los Angeles, Philadelphia - With BingMAP API in RStudio
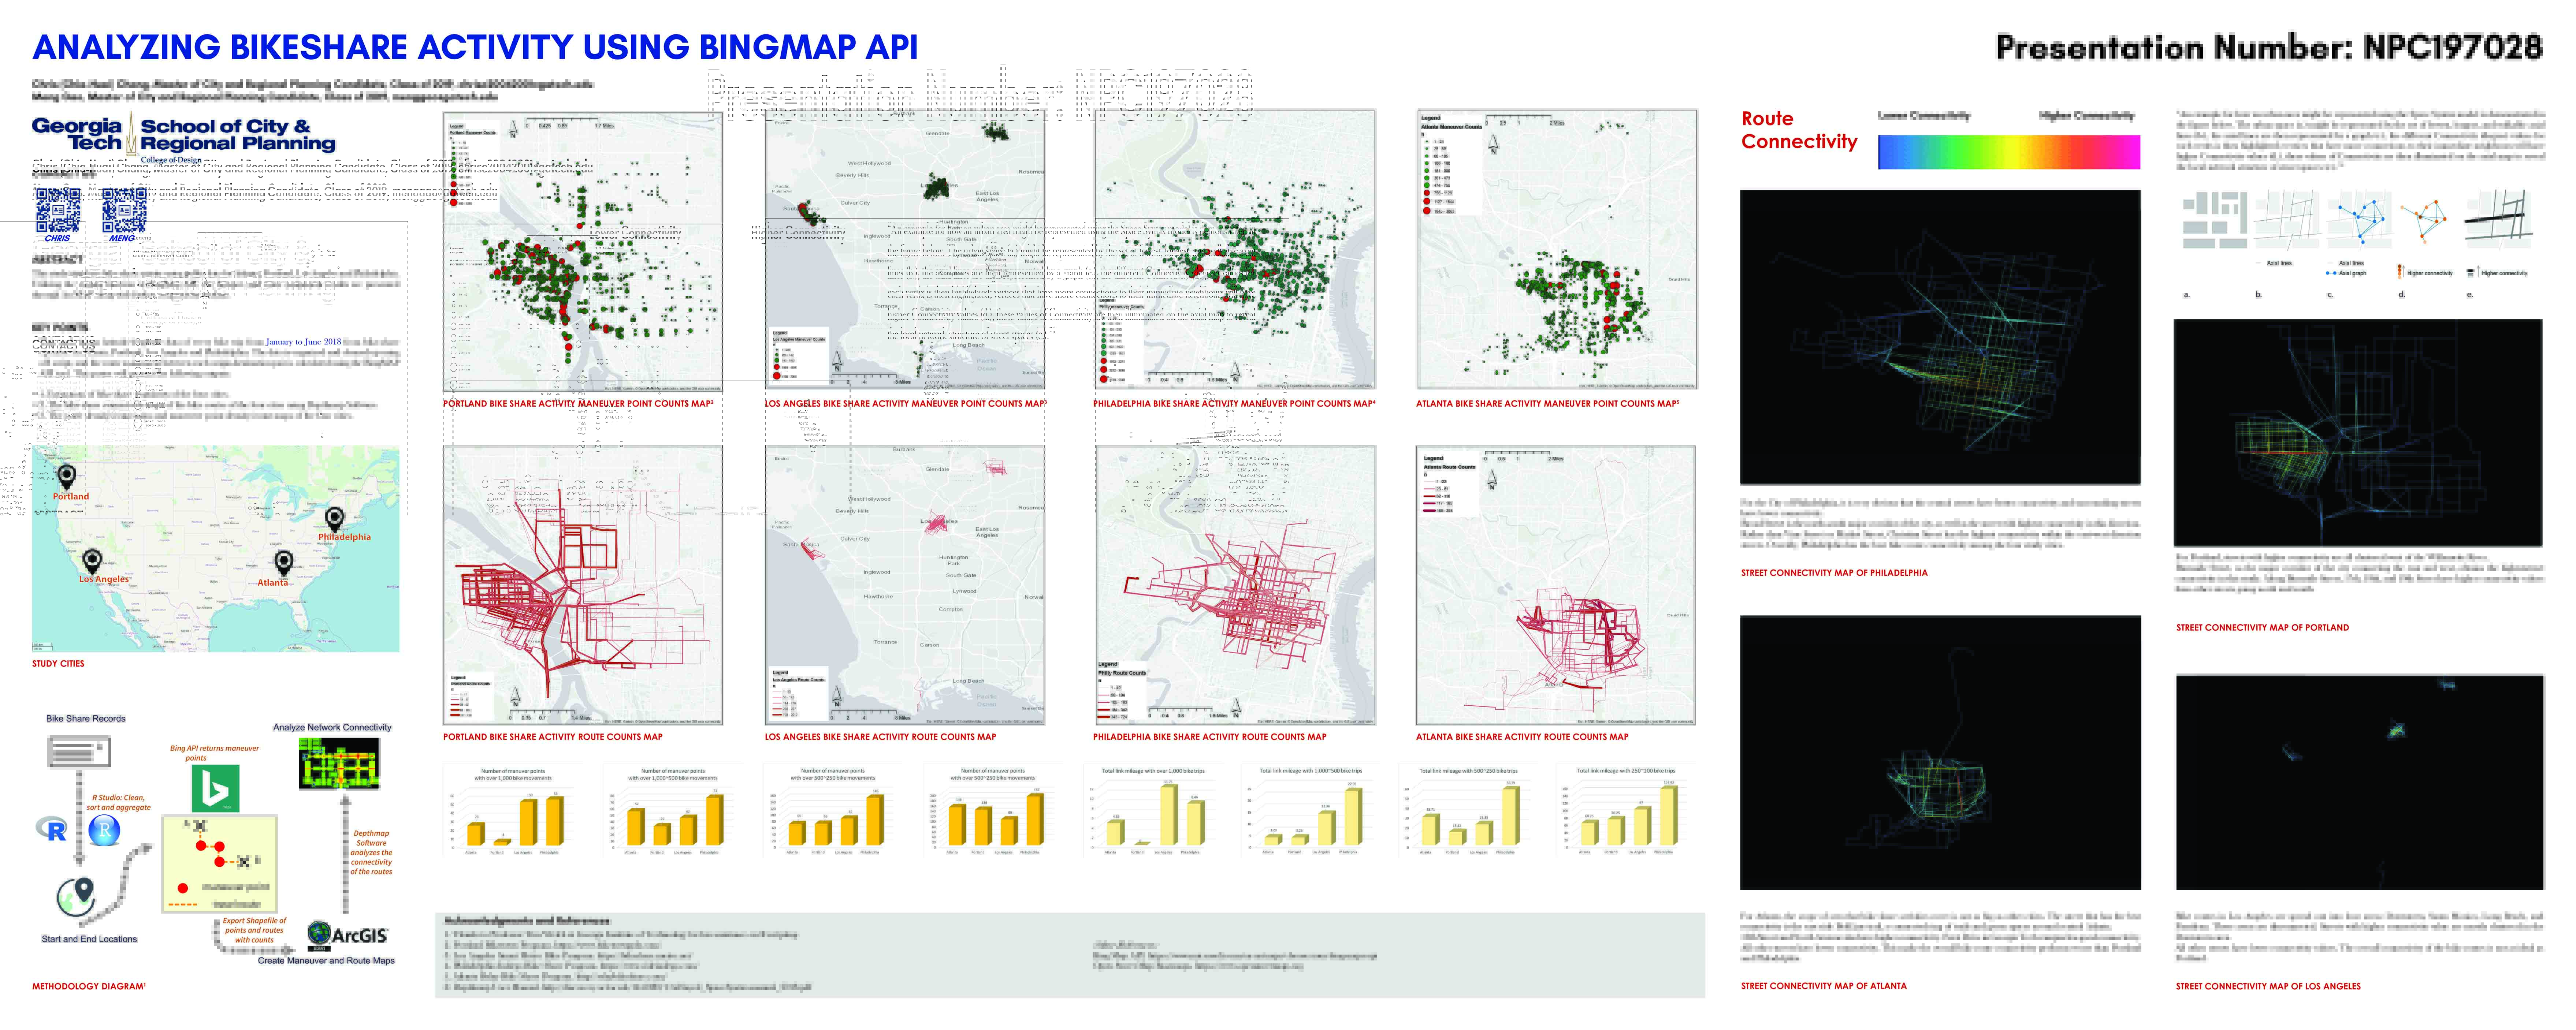
This project utilizes the monthly Bikeshare trip data provided by operator in Atlanta, Portland, Los Angeles and Philadelphia and visualizes bike share activity using BingMAP API via a specifically developed R script.
This project aims to find out:
Which routes do bikers most likely take? Which ones are the more popular routes?
Which intersections do bikers stop and make turns?
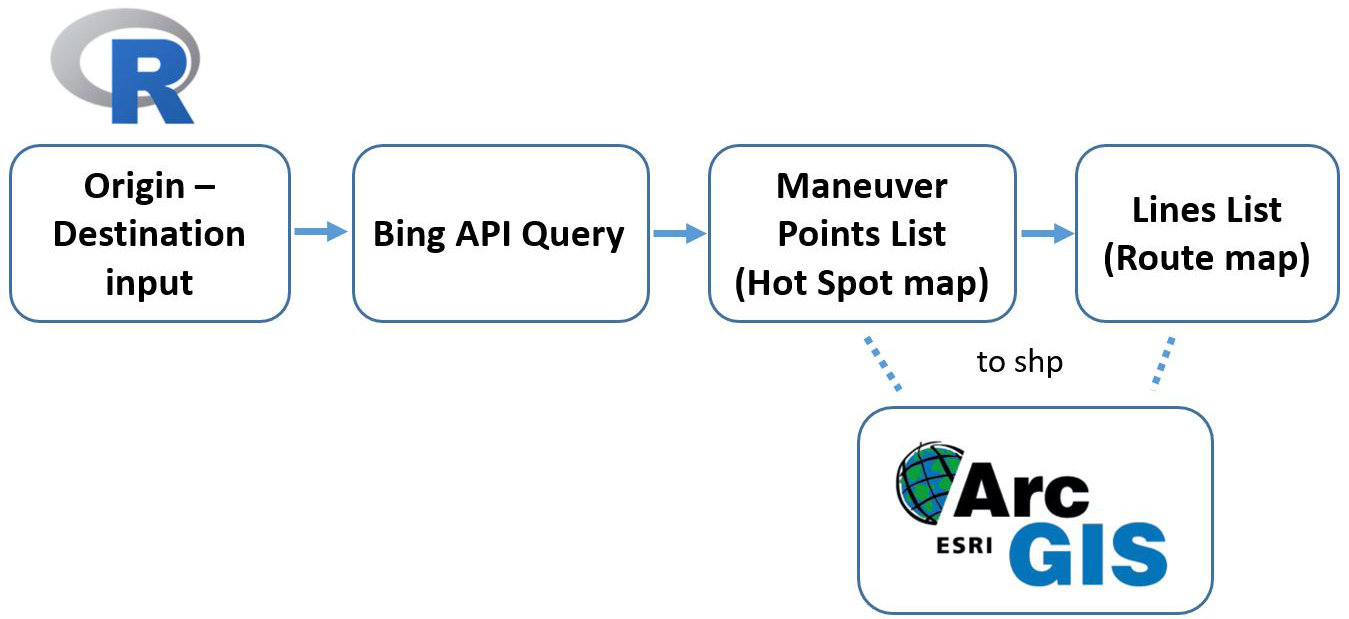
Data from all four cities include the start and end longitude and latitude of every trip. Using that as the input, a R script is developed to prepossess and filter out invalid data. Trips with the same OD (origin&destination) are classified as a unique trip and are given an ID. The script then uses the Bing API to request the optimal routes for every one of those OD pairs. Data from the Bing server returns the locations of the intersections when change of direction occurs. From that Hot Spot maps for bike turning movement for all four cities are generated. These intersections are then connected to form a collective route map for all the bike trips. Line width are weight by the number of trips that occur on that specific route. A simple flowchart of the script is shown below.
This project uses Jan ~ June 2018 data from Relay (Atlanta), Biketown (Portland), Metro Bike Share (Los Angeles) and Indego (Philadelphia). All four data sets have over 30,000 data entries.