Did Walk Score Increase Home Price in Seattle
Recently, I read a few articles about how the walkability of the neighborhood has increased the home prices. From a recent Redfin research, it is said that “In U.S. cities, homes within walking distance of schools, shopping, parks and other urban amenities sell for an average of 23.5%, or $77,668, more than comparable properties that are car dependent.” I wanted to verify this using real-estate records for the 1,902 random Seattle homes that I pulled for my previous post from Zillow API. To get the walkability for each of the 1902 homes, I used Walk Score API and downloaded the Walk Score and walkability category for the homes, and here is what I got.
Average Walk Sore by Housing Type
I calculated the average Walk Score by housing type. It is obvious that single family houses are more likely to be located in more car-dependent neighborhoods, whereas multifamilies have better access to walking facilities.
| Housing Type | Average Walk Score |
|---|---|
| Single Family | 61.0 |
| Condominium | 60.5 |
| Multifamily 2-4 Units | 66.4 |
| Triplex | 80.8 |
| Townhouse | 74.5 |
| Multifamily 5 Plus | 76.4 |
Walk Score and Home Sales Price
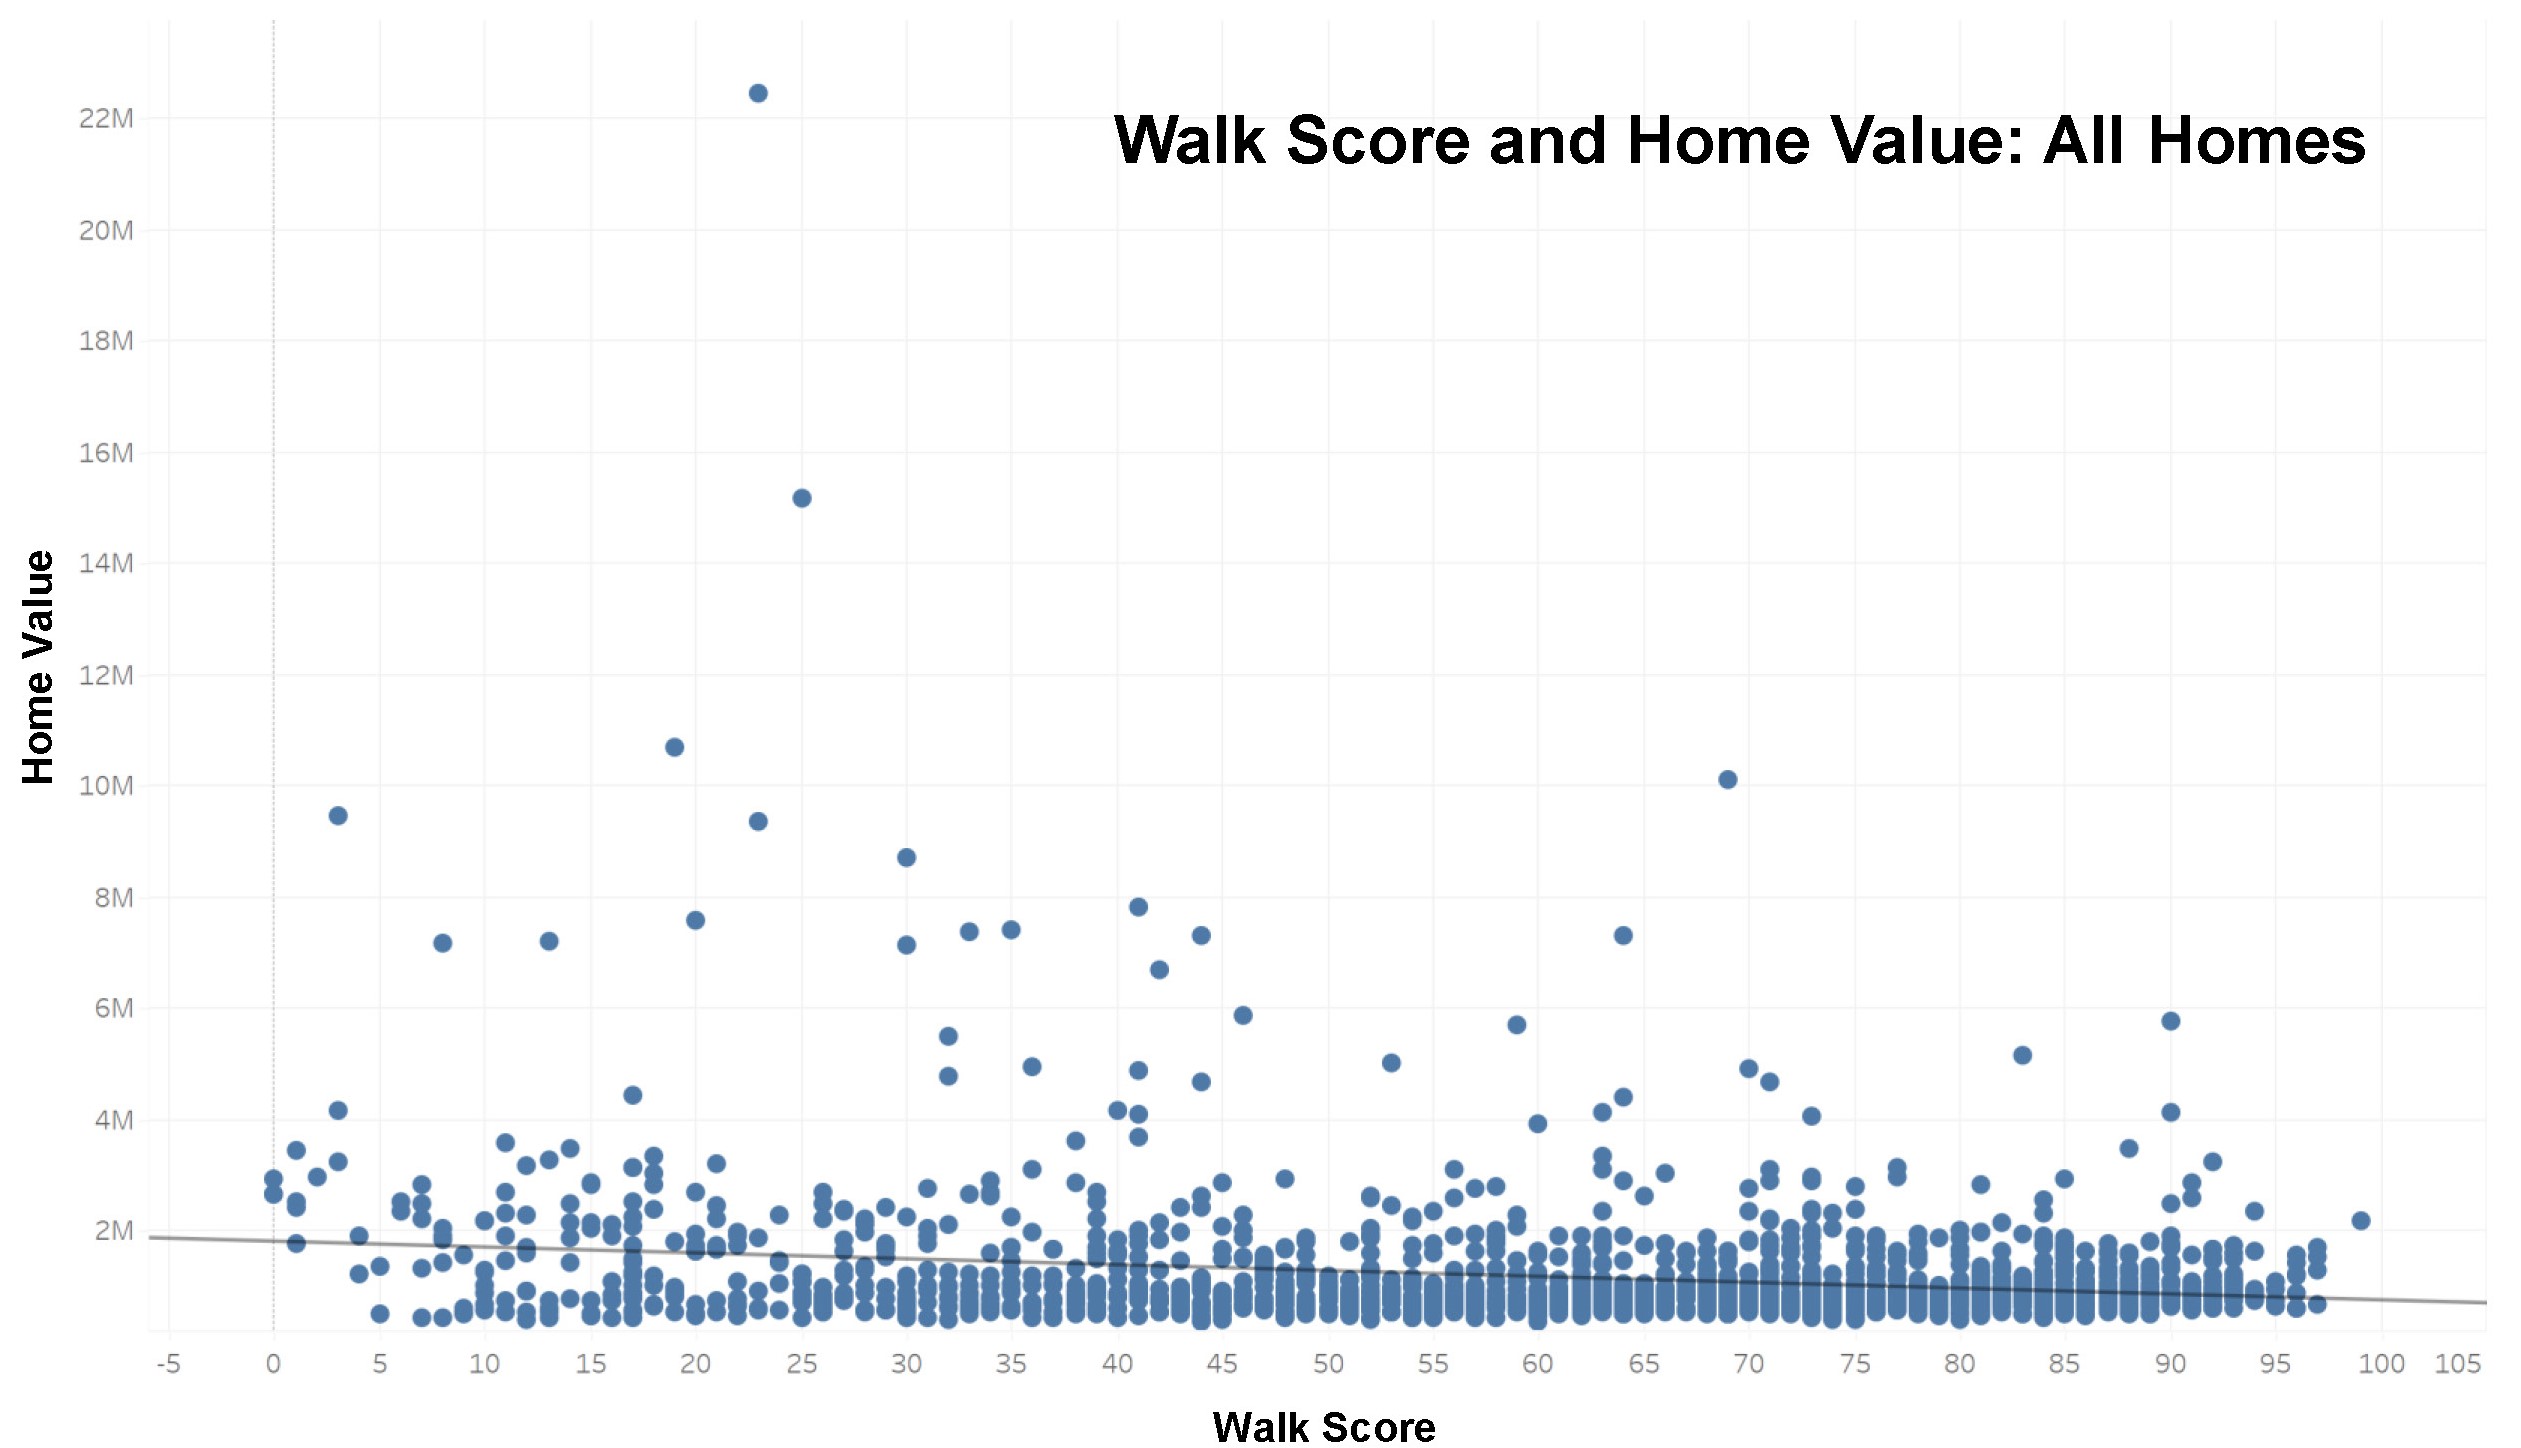
I compared theZestimate® high value with the walk Score in a scatter plot. It seemed that home prices increased with the decrease of Walk Score.

Then, I plotted the Walk Score on the map, where we can see the existence of a lot of waterfront homes. These home locations typically have low walkability, and they have extraordinarily expensive prices. From the map we can also see that these places have better walkability: Queen Anne, Northwest Seattle, Wallingford, North Seattle, Central District, and Hillman City.

As I gradually filtered the home prices from high to low, the slope of the regression line turned positive when homes were lower than 2 million dollars. It means that for homes with a reasonable price, the increase of Walk Score can increase the home price.

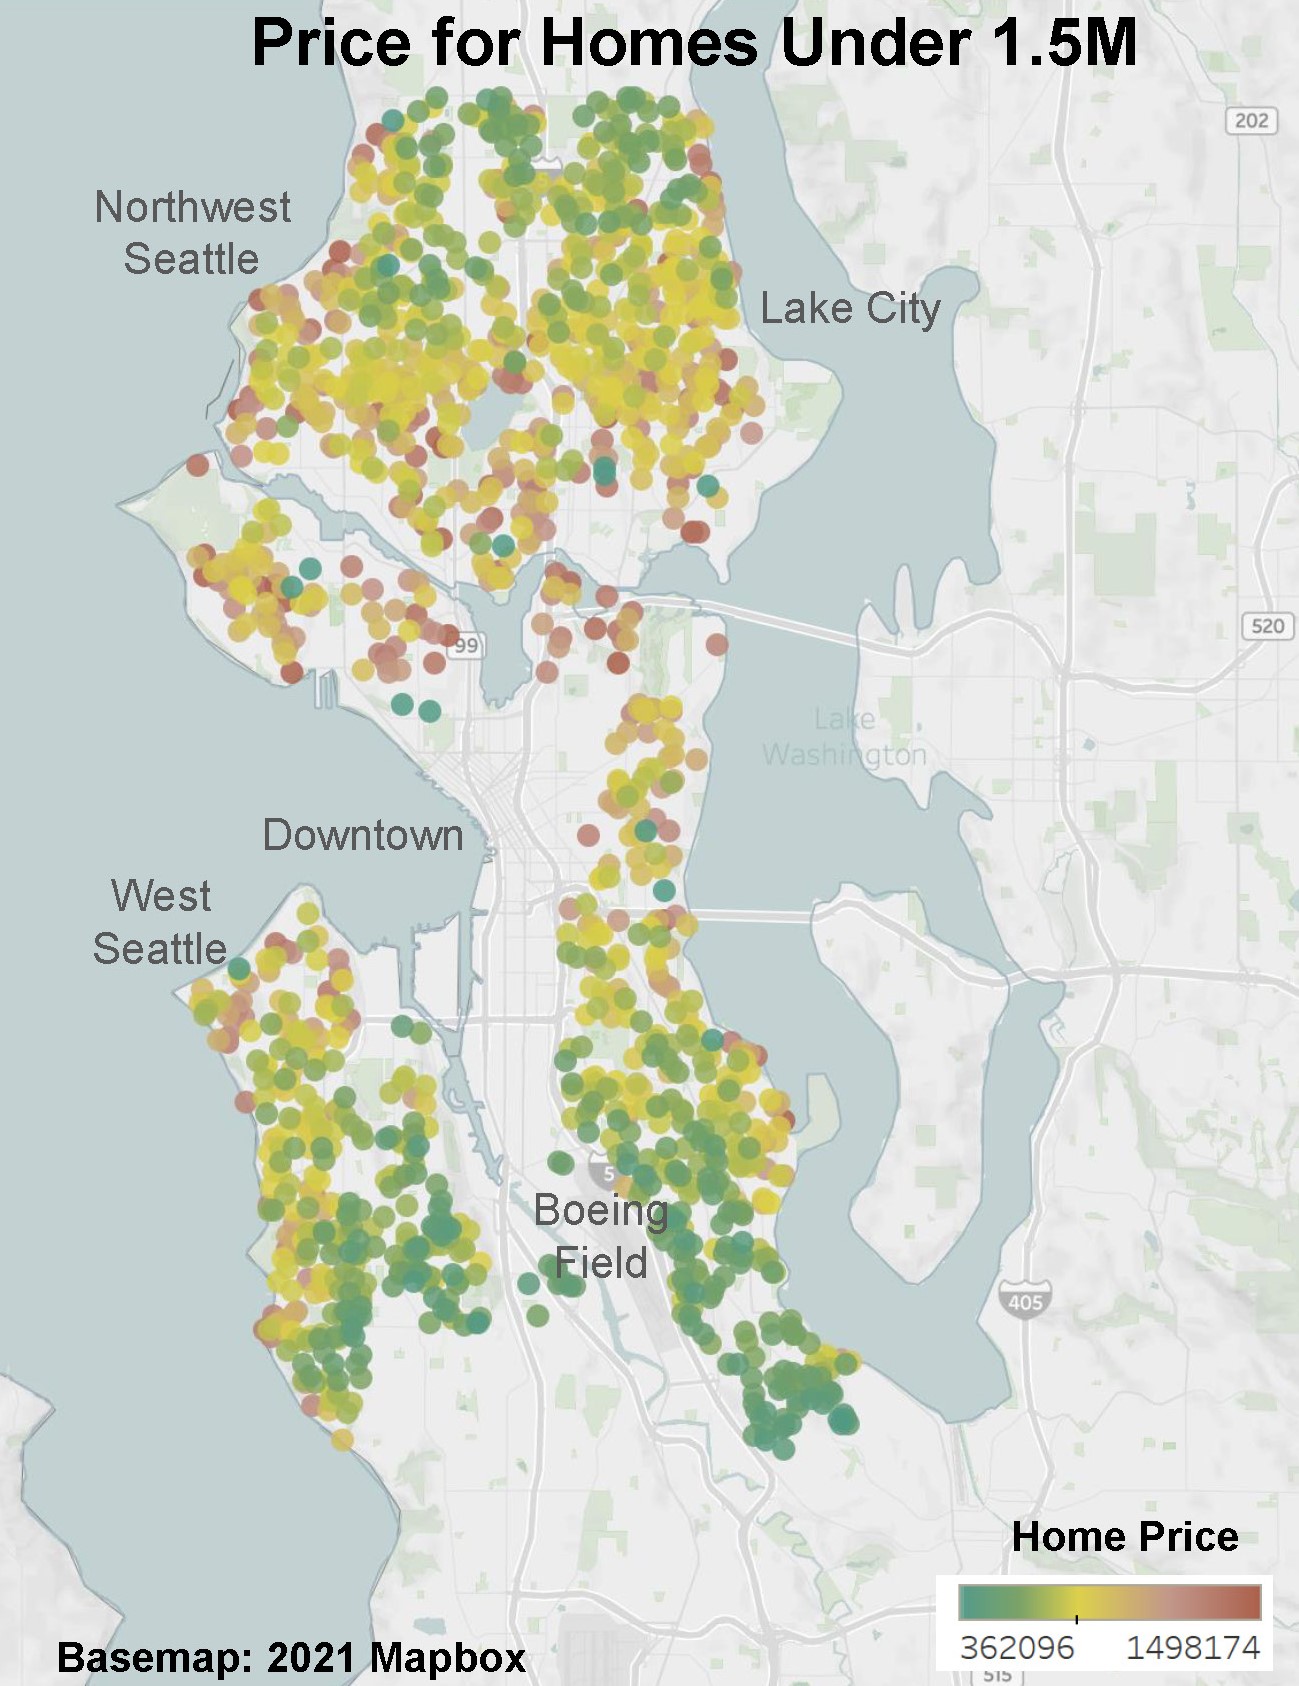
Then, I plotted on the map the home price for homes under 1.5 million dollars. We can see that these places have less expensive homes: south of West Seattle Bridge, around the King County International Airport, Northwest Seattle, and North Seattle.

We can say that these places have relatively lower home prices and higher walkability: Northwest Seattle, Fairmount Park, and Columbia City.

Walk Score and Year Home Built
The year the home was built was also part of the available information from Zillow API . When I plotted the year built and Walk Score in a scatter plot for all the homes, we can see that the younger the home, the less walkable the home’s location.

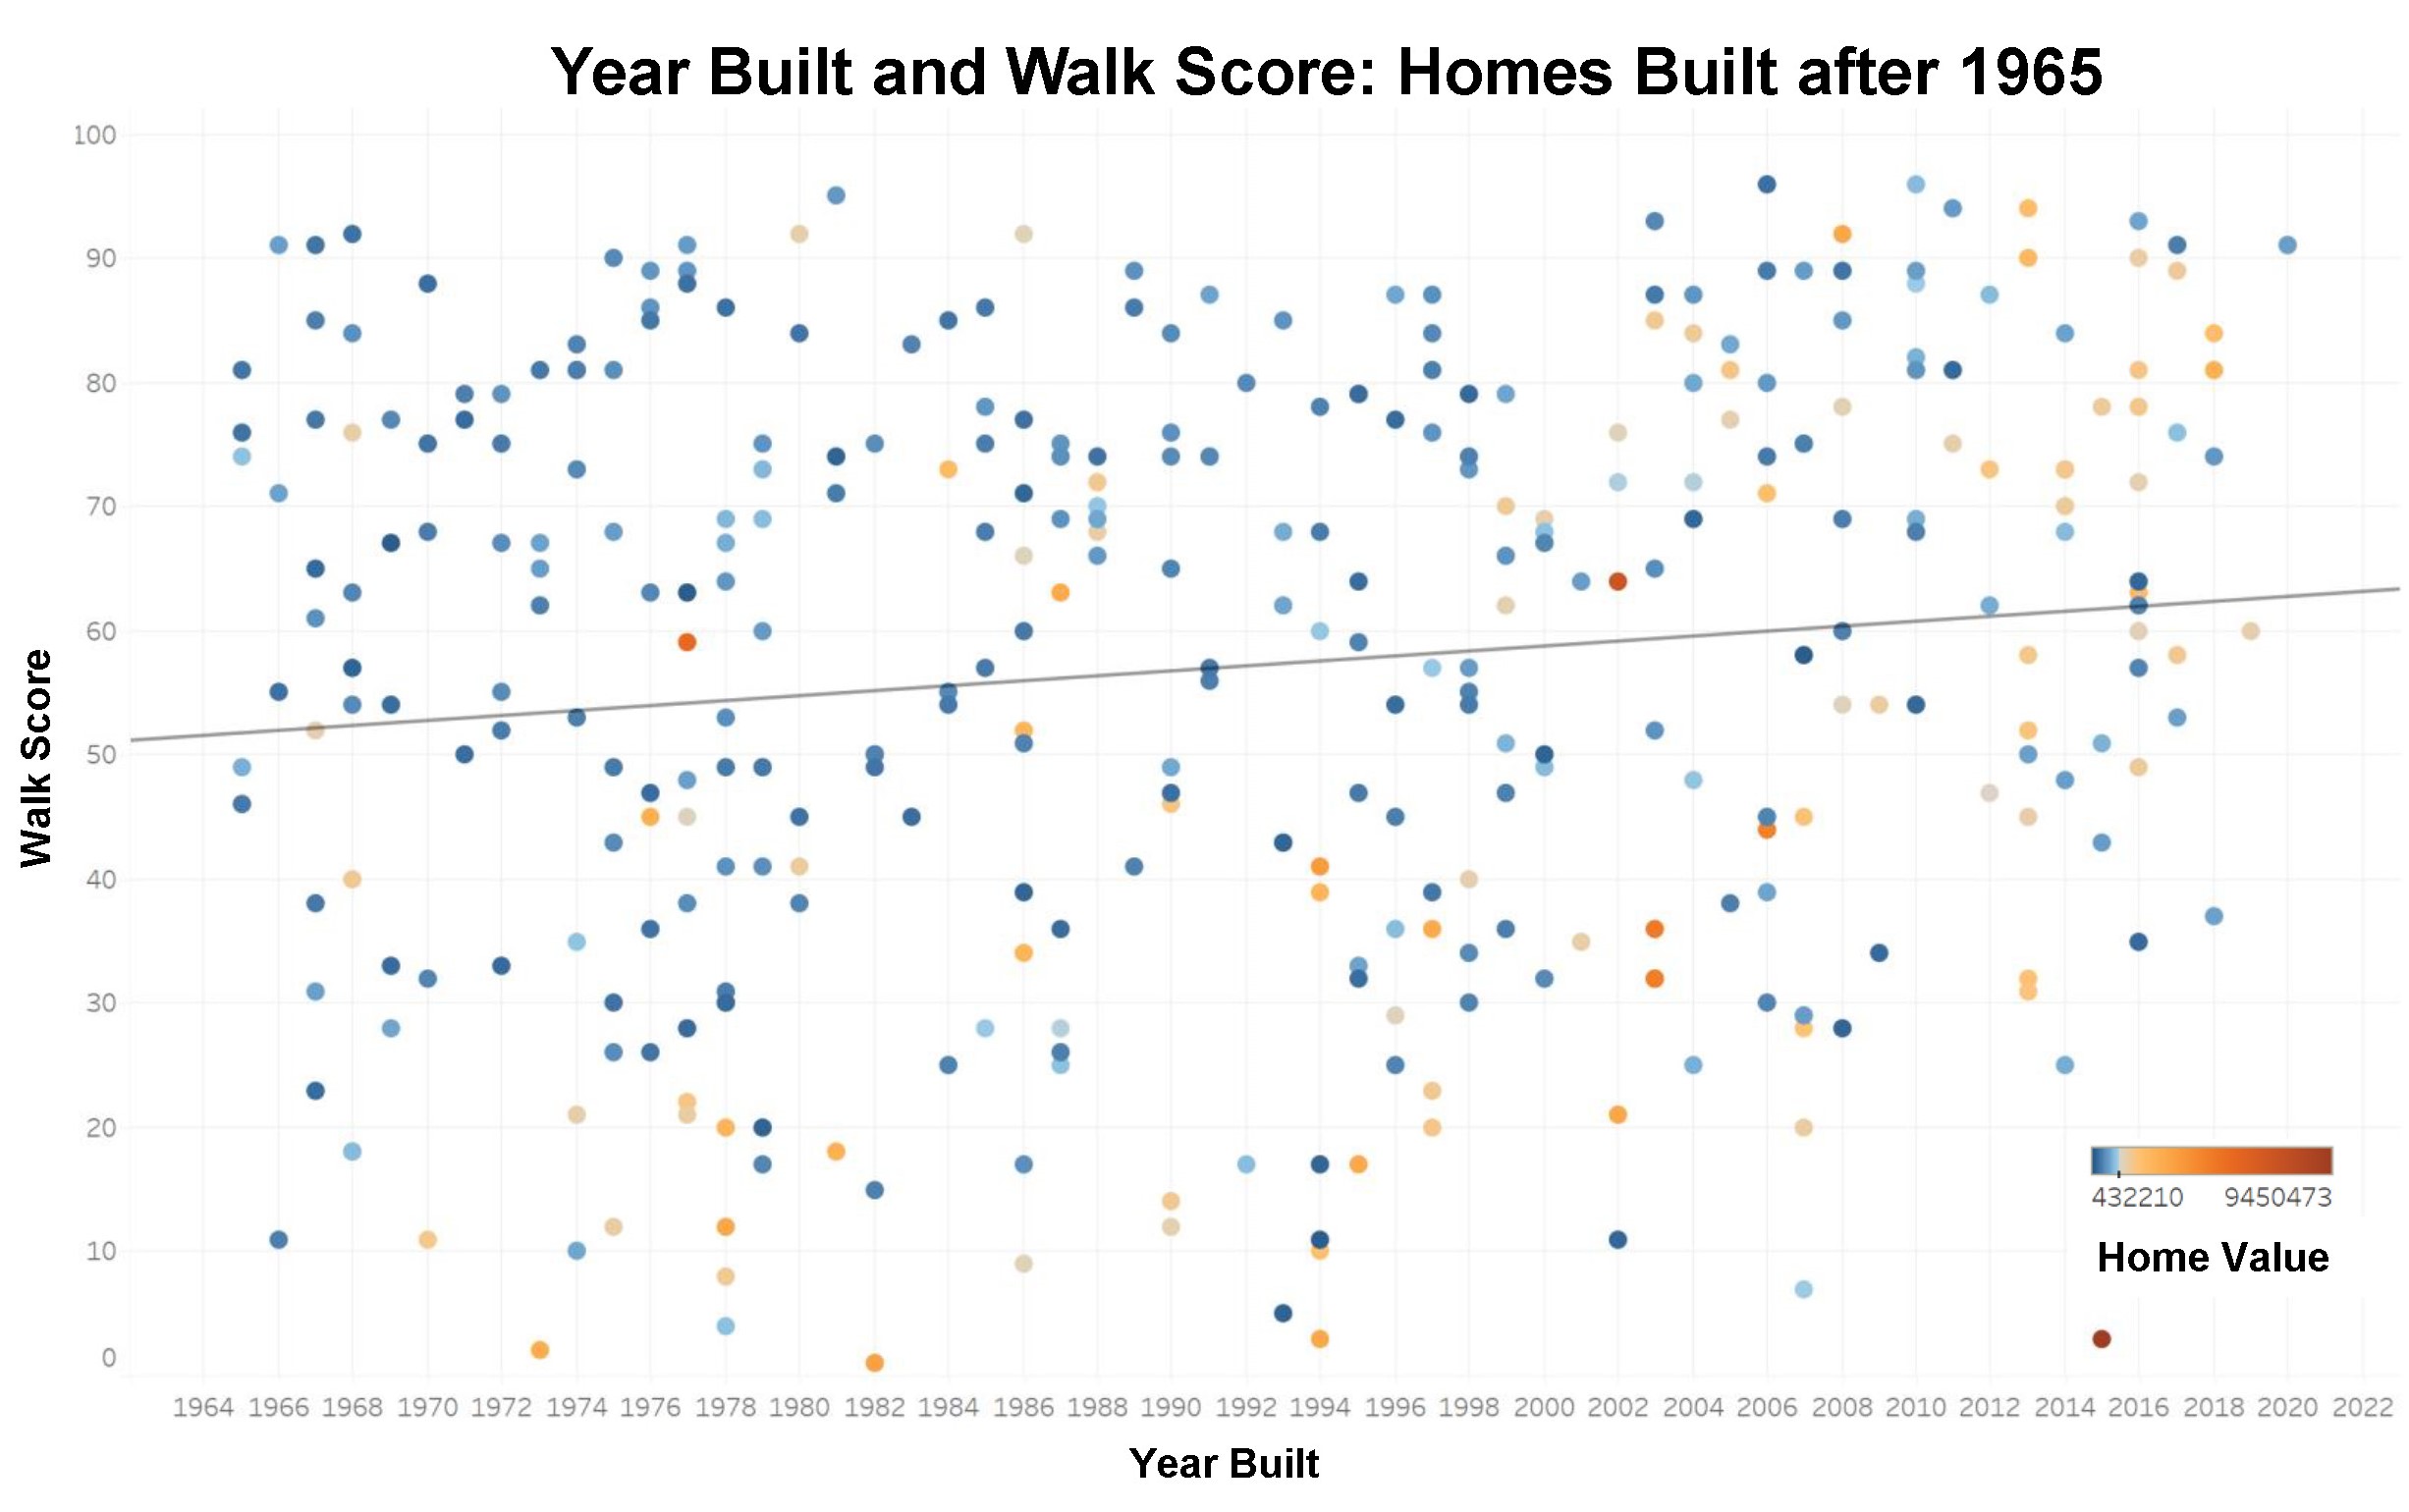
However, I noticed that a huge amount of homes were built before 1965 that had low Walk Score. Then, I filtered the year built to be after 1965 and made the same scatter plot.

Here, we can see that after 1965, newer homes are built in places with better walkabilities these years.
Conclusion
Data can be deceptive. Without applying the reasonable filters, I would have concluded totally different results from this sample.
And yes, in Seattle, when not considering waterfront villas and antique homes, the walkability of the location can increase the home price, and newer homes are being built in more walkable locations.
Notes and Data Source
Please note that there’s a data discrepancy issue in this study. Data from Zillow were downloaded in January 2020, and Data from Walk Score were downloaded in April 2021.
Walk Score Disclaimer:
https://www.walkscore.com/WA/Seattle
https://www.walkscore.com/how-it-works/
Zillow Disclaimer
© Zillow, Inc., 2006-2016. Use is subject to Terms of Use
