Working with ArcGIS Mosaic Datasets:Add, Extract and Management
Working with raster layers can be tricky when it comes to data management. Sometimes, for various reasons, we would like to put multiple raster layers with different types under one ESRI file geodatabase. The limitation is that we cannot put raster datasets in a feature dataset. Therefore, using mosaic datasets to categorize raster layers will be a solution. As a result, we don’t need to put 100 raster layers directly under the file geodatabase. We can categorize them by projects/geography/steps. This article talks about the workflow of working with mosaic using the example of Washington State Landsat 8 satellite images: downloading, adding to mosaic dataset, add single layer to a map, change symbology.
Pro:
Mosaic dataset can handle datasets with varying resolutions—spectral, spatial, temporal, and radiometric. It allows us to store, manage, view, and query collections of raster and image data.
Cons:
Need up-front time and effort to set up the dataset. Not intuitive when using the catalog to view multiple raster layers. Need extra steps to add specific raster layer(s) to the map.
Case Study: manage multiple satellite images in a mosaic dataset within a file geodatabase.
Step 1: Download satellite images from USGS Earth Explorer.
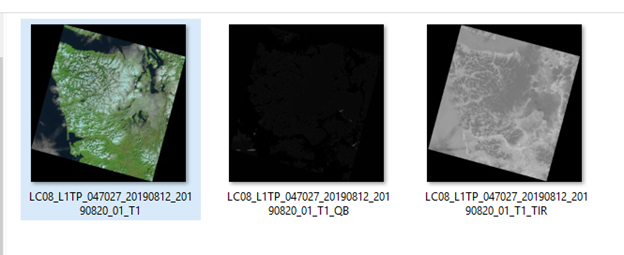
You will need to register an account to download data. This is how I downloaded three Landsat 8 images for north Washington. On the “Search Criteria” tab, change to “circle” tab. Zoom and click on Seattle on the map. This will automatically fill in the lat and long in the search bar. Then, add a radius to the search area. (I searched for a 1000-km radius.) In the search result, select Landsat 8 if you want to download Landsat 8 data. Pick the product you want and click download. When downloading, select the georeferenced images.
These file names mean: Landsat 8, Precision Terrain, Path047, Row027, Acquired on August 12, 2019, Processed on August 20, 2019, Collection 1, Tier 1. You can refer to this guide: LANDSAT SURFACE REFLECTANCE-DERIVED SPECTRAL INDICES.
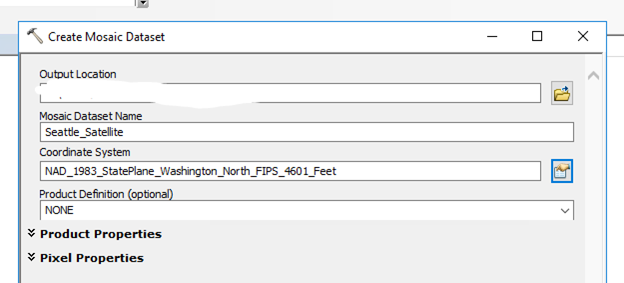
Step 2: Create a mosaic dataset.
There are two ways of creating mosaic dataset using either ArcGIS Pro or ArcCatalog. In ArcCatalog, navigate to the working file geodatabase, right click on the database name in the Catalog Tree, and click “New”- “Mosaic Dataset…”. In ArcGIS Pro, run the “Create Mosaic Dataset” tool. Then, configure the name and the coordinate system of the mosaic dataset. In this case, I used NAD 1983 State Plane Washington North FIPS 4601 (US Feet).
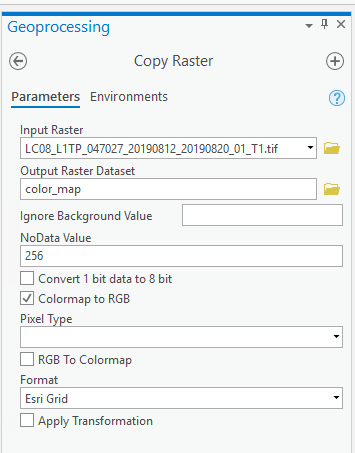
Step 3: Copy Raster to ESRI grid format.
This step is optional. Don’t need to do this step if the original raster layer only has 1 band. This is an ESRI bug that if we add satellite images (more than one band) directly into the mosaic dataset, ArcGIS will merge the bands and we will lose band information. As a work around, in this case study, I performed Copy Raster to one of the images. Remember to click “Colormap to RGB” when exporting.
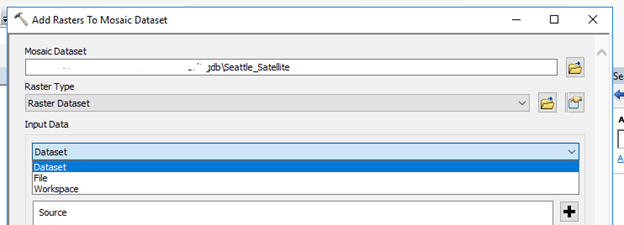
Step 4: Add raster layers to the mosaic dataset.
In ArcCatalog or the Catalog Pane in ArcGIS Pro, right click on the created mosaic dataset, and click “Add Rasters…”. If we want to add a raster layer that’s already in a file geodatabase, we can change the Input Data type from “Workspace” to “Dataset” from the drop-down menu. Then, we can navigate to the proper file geodatabase or folders and add multiple raster datasets.
Fun fact: In the previous step, I only performed copy raster on one layer. By adding this layer to the mosaic dataset, all layers in this mosaic dataset will not lose bands.
Step 5: Dealing with raster layer within the mosaic dataset.
In ArcGIS Pro or ArcMap, click on “Add Data”, and add the whole mosaic dataset to the map. When first added, the mosaic layer will appear as a group of three layers “Boundary”, “Footprint”, “Image”.
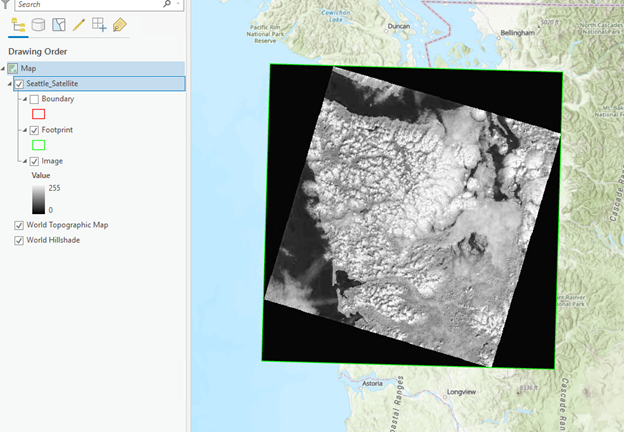
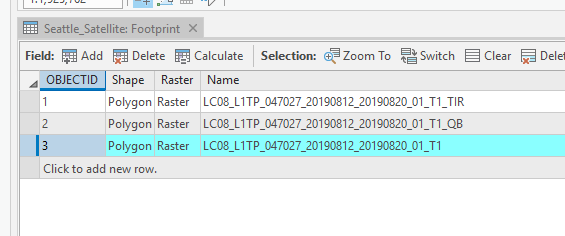
Please note that now, the map is displaying all the layers without image value configuration. Right click on the Footprint, and open attribute table. Now, each raster dataset is displayed as one row of the attribute table. Click on the row of raster dataset that you want to display.
Now, right click on the “Image” layer, and under “Selection”, click “Add To Map”. In the popped out “Add selected rasters to map” window, name the new group layer name and hit OK. I displayed the RGB data as real color. You can also change band combination by configure in the symbology tab. Here, ESRI will ask you to calculate statistics. Hit yes.
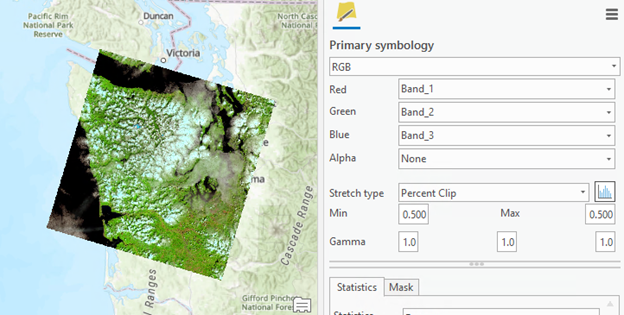
You can also change symbology type to Stretch for satellite images after the statistics and histograms are calculated. Then, I changed the stretch color scheme and intervals. This gives us an opportunity to play around with the cell values.